UV-visible Spectroscopy: Data Processing
Determine the concentration of quinine in the unknown with the 95% confidence interval, and use metrics such as LOD, LOQ, and QC percent difference to determine if the results are reliable.
Note: In addition to the steps below, you are expected to write your intro, conclusions, etc., and fill in all portions of the template. You should also provide notes throughout that provide context as to what your calculations are doing.
Table of Contents
Step-by-Step Video Tutorial
This video walks you through the data processing step-by-step. The goal is to help you get familiar with Julia and Pluto before you try it on your own in the rotation labs!
Having trouble viewing this video? Click here to view it on Panopto instead.
Create a Lab Notebook and Calculate Standard Concentrations (Before Lab)
- Complete the steps under the prelab section if you did not already do so. Make sure you enter your actual standard concentrations.
Import and Format Your Data (During Lab)
-
Paste your data file(s) into your lab 1 folder. If you are using the suggested path this folder is at
/Documents/lab-notebooks/lab-2/. -
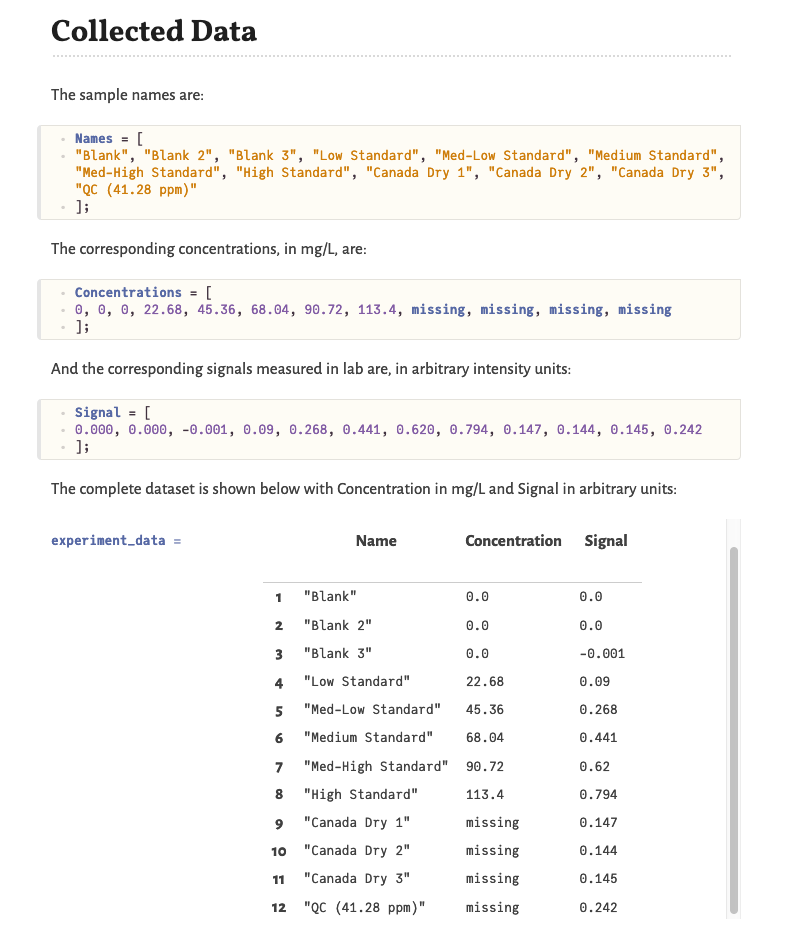
For this lab you should have most data in manually during lab. Make sure you have your data frame formatted like the one below.
Fit a Standard Curve (After Lab)
-
Fit a linear model of the form $S_a = k_a C_a + b$, where $S_a$ is the analyte signal and $C_a$ is the analyte concentration. Call your model
calcurve. In Julia, a linear model can be fit thusly:fitName = lm(@formula(y ~ x), DataFrame) -
Use the fit to determine the sensitivity coefficient, $k_a$, and intercept, $b$. These fit coefficients can be found using:
GLM.coef(fitName)[n]where
nis 1 for the intercept and 2 for the slope. -
Extract the $R^2$ value from the fit using the function
r2(fitName). -
Plot the standard data and line of best fit on a single plot.
begin
     plotly();
     scatter(x, y, grid = false, label = "Label Text");
     xlabel!("X Label Text"); ylabel!("Y Label Text");
     xlims!(min, max); ylims!(min, max);
     Plots.abline!(slope, intercept,
         label = "$(round(intercept, sigdigits = 4)) + $(round(slope, sigdigits = 4)) x,  R²=$(round(R2, sigdigits=5))", color = 1
     );
 end
Validate the Standard Curve
-
Determine the concentration of the QC by using it’s measured signal value and solving for $C_a$ in the equation obtained from your standard curve.
-
Determine the percent difference between the QC’s measured concentration and true concentration. This should be <5% as a general rule.
Determine the Sample Concentration
-
Determine the concentration of quinine in the sample by using it’s measured signal value and solving for $C_a$ in the equation obtained from your standard curve. Make sure you calculate the average concentration
-
Determine the 95% confidence interval on the concentration. I have provided the function
calculateCI(model, std_conc, std_signal, new_signal, t = 3.182)for this purpose. You should understand the formula used to calculate the CI – see the information provided in this section of the lab notebook template for details. -
Report your final concentration as $\bar{x} \pm \text{CI}$, where $\bar{x}$ is the average quinine concentration and $\text{CI}$ is the 95% confidence interval.
Determine the Limits of Detection and Quantitation
-
Determine the limit of detection (LOD) and limit of quantitation (LOQ) for this method using the standard deviation, $s$ of your blank. Use the following definitions:
\[LOD = \frac{3 s_{blank}}{k_a}\] \[LOQ = \frac{10 s_{blank}}{k_a}\]Is the signal you measured quantifiable?
Don’t for get to discuss your results and write a conclusion!